My 12V Lead Acid Battery does not hold it's Charge.
Using an old battery charger the battery was charged, but it is not holding the charge.
Also it did not seem to charge at a high current, and drop down when charged.
Maybe a cell or two are faulty!
I want to see it it holds its charge, and if under load how long it powers the load. The battery is a 44 Amp Hour so should power a 25W bulb for a day.
Some measurements may takes many hours to log. An Arduino and the SD card example provide a very good staring point.
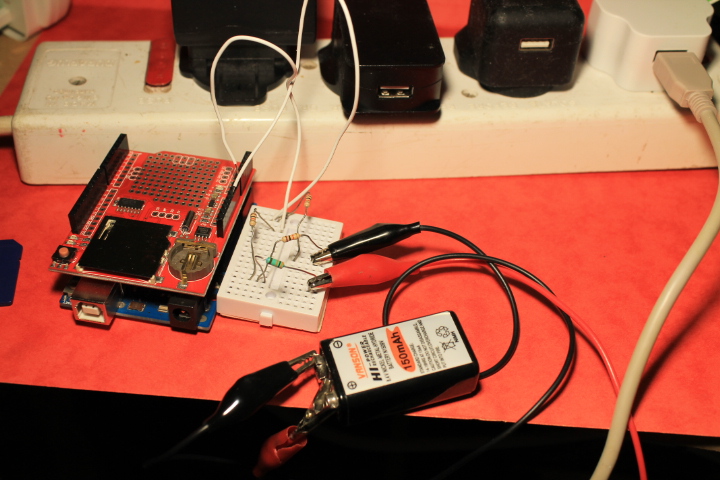
The Arduino can measure voltages, but the values are relative to its power supply voltage. It cannot measure inputs more than the supply rails, so a voltage divider must be used.
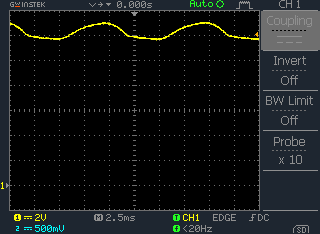
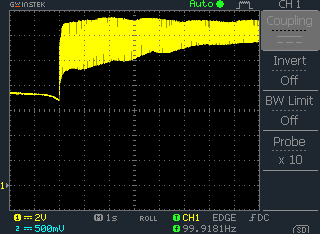
Any ripple on the power supply affects the measured voltage.
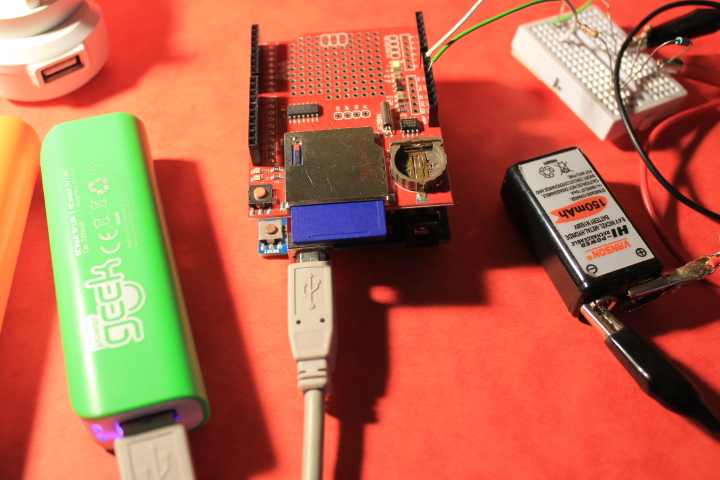
Using a 9V battery to check calibration and ripple of the USB power supplies that could be used to power the logger.
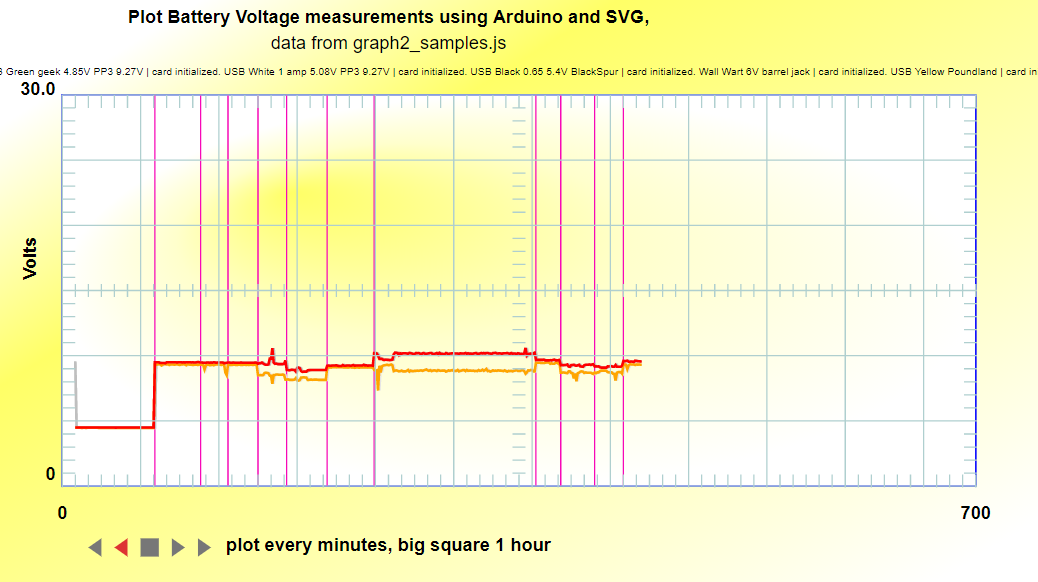
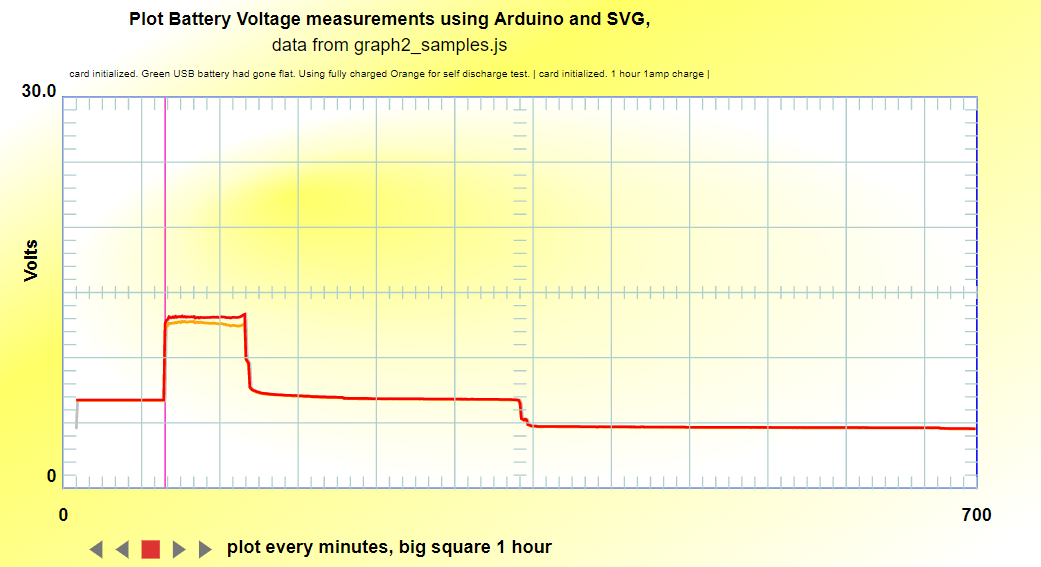
A Print Screen capture of my plot.
I used the Geek USB power bricks and the USB 5V 0.65A power bricks to power the logger when I measured the Lead Acid battery.
The USB 5V 0.65A power brick has a lot of ripple on Vcc that affects the measurement of the lead acid battery.
In this experiment, the time to discharge the battery using the 25W bulb or self discharge was the important measurement.
The Arduino API does not allow the band gap voltage source to be read. There are examples on the web how to do this. To Do later.
IMPORTANT: DO NOT CONNECT A BATTERY to ARDUINO INPUTS without resistors. The chips latch up, and the ARDUINO chip will get hot and could be bricked.
EVEN IF THE BATTERY IS LESS THAN VCC, THE RESISTORS ARE ESSENTIAL.
You could damage the ARDUINO, if the battery voltage is above VCC.
If the logger power supply fails so Vcc is less than the input voltage the resistors limit current and the protection diodes clamp the input voltage.
I have another logger project. I powered teh logger using rechargeable batteries which went flat, and Vcc was below the fully charged battery being measured, and the chip was damaged. The battery undertest caused a large flow of current via the protection diodes into the battery powering the logger.
THE MAX CURRENT INTO THE PROTECTION DIODES NEEDS TO BE LIMITED BY THE RESISTORS.
+ve ---[30K]---+--[10k]----  A0
               |
              [10K]
Vbat           |         Arduino + SD card shield + USB battery
               |
-ve -----------+--[10k]----- GND
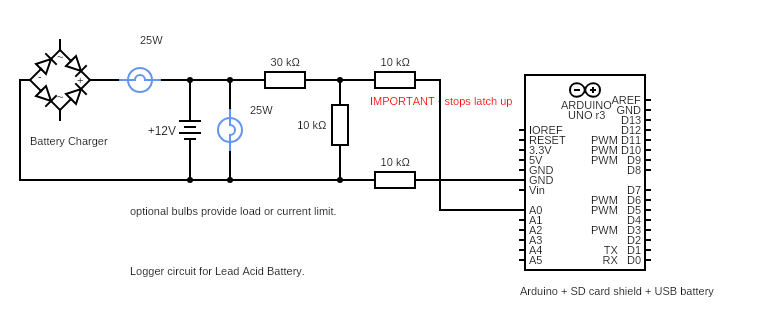
drawn using https://www.circuit-diagram.org/editor/
The SD card library has an Logger example, which is a great starter.
http://www.arduino.cc/en/Tutorial/ReadAnalogVoltage
It is 90% to 99% of what I wanted.
https://www.arduino.cc/en/Tutorial/LibraryExamples/Datalogger
https://www.arduino.cc/en/Reference/SD
http://www.dougrice.plus.com/dev/arduino/ReadAnalogMinMaxVoltage/
Was used to end up with my sketch:
http://www.dougrice.plus.com/dev/arduino/ReadAnalogMinMaxVoltage/ReadAnalogMinMaxVoltage.ino
The logged measurements were plotted using SVG:-
http://www.dougrice.plus.com/dev/arduino/ReadAnalogMinMaxVoltage/graph2.svg
(This wiki does not display .svg files as pictures.)
Code was added to log Vmin and Vmax
The Battery Charger has a lot of ripple. Unsmoothed 50 Hz rectified.
and
This would confuse the log and graphs.
The Arduino can be powered by:
Using an old battery charger the battery was charged, but it is not holding the charge.
Initaly, the Battery would only charge at 1 amp.
There are a number of configurations, which could be measured.
Arduino Example logs Vmin,Vmax to DATALOG.TXT, appending data every second.
My SVG graph file includes graph2_samples.js, which contains the the data logged every second.
graph2_samples.js has the data wrapped in a function call.
v2("Vmin,Vmax")
Load this and plot it.
I could get the logger .ino to output in the correct format, but did not.
Use an AWK script to convert DATALOG.TXT to graph2_samples.js
 graph2.awk
 usage: awk -f graph2.awk DATALOG.TXT > graph2_samples.js
BEGIN{
 FS="[,\n,\r]"
}

/,/ {
  print "v2('"  $1 "," $2 "," $3 "')"
}
When the Logger is turned on, it logs
-1,-1,card initialized.
Then every second it logs: Vmin,Vmax
My SVG graph file includes graph2_samples.js, which contains the the data logged every second.
graph2_samples.js has the data wrapped in a function call.
v2("Vmin,Vmax")
Load this and plot it.
There could be hours of data so sub-sampling is required.
Sampled Data suffers from aliasing.
You should use a low pass filter to stop aliasing.
If you plot every minutes, then the anti-aliasing low pass filter should be filter frequencies above 1/minute Hz.
My scope has a Vmin and Vmax feature.
If you sub-sample, aliasing can confuse the readings.
A way around this is to measure the min and max values seen at the fastest sampling rate, but only log Vmin and Vmax each log.
If you further sub-sample find the minimum min and maximum max.
30 years ago, the HP logic analyser we used, had a glitch feature that remembered glitches smaller than the sample rate. This was useful. The Vmin, Vmax technique used here is similar.
Plotted using SVG:-
http://www.dougrice.plus.com/dev/arduino/ReadAnalogMinMaxVoltage/graph2.svg
<html> <img src="http://www.dougrice.plus.com/dev/arduino/ReadAnalogMinMaxVoltage/graph2.svg" > </html>
This wiki does not support SVG images, so I did ALT Print Screen to capture these images.
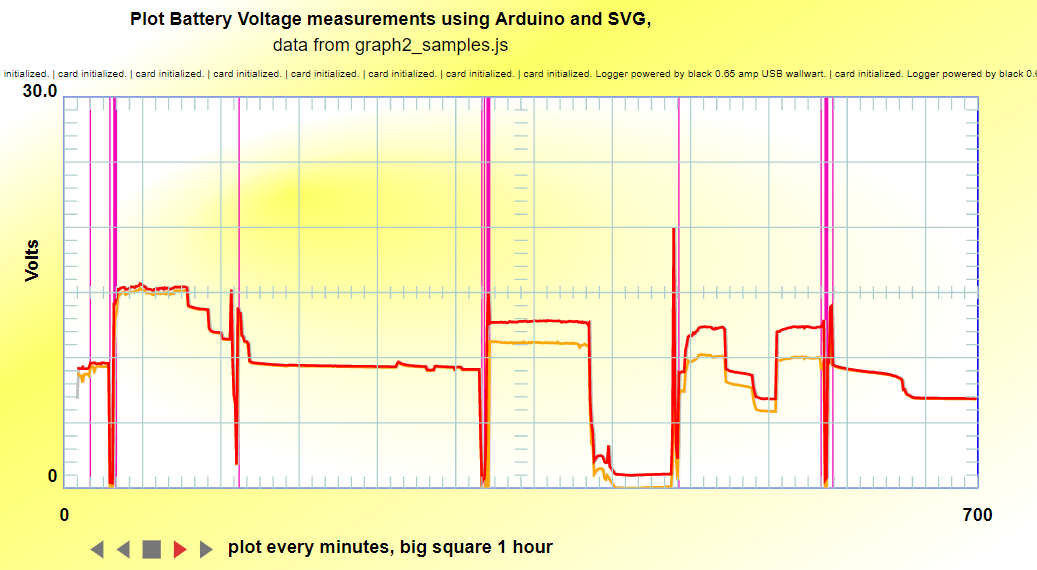
Note:- My Arduino Sketch assumes Vcc is 5V, the USB power supplies range from 4.85 to 5.4 V so affect the displayed voltage of the Lead Acid Battery.
I used the Geek USB power bricks and the USB 5V 0.65A power bricks to power the logger.
The USB 5V 0.65A power brick has a lot of ripple on Vcc that affects the measurement of the lead acid battery.
In this experiment, the time to discharge the battery using the 25W bulb or self discharge was the important mesurement.
The Arduino API does not allow the band gap voltage source to be read. There are examples on the web how to do this. To Do later.
The battery did not hold its charge, and discharged within 12 hours.
The USB power brick used to power the longer could run for just long enough.
The Arduino did not sleep and it has LEDs which consume current.
Using a 5V USB WallWart plug power supply put a log of ripple on Vcc which shows up in the Vmin and Vmax.
Using the SVG web page to plot debug data is interesting and quicker than loading into Excel, once set up.
![[Home]](../ipstats.gif)