Plotting nice graphs is not easy. They look clumsy.
At work you used EXCEL, the default graphs are reasonable. However if you generate the data in a CSV file, EXCEL locks the file.
Tips to make them look better.
My second computer was the NASCOM 2. It had a very limited graphics, back and white 180x75 and used BASIC.
You really need functions and procedures so Microsoft 8K Basic and my code went nowhere.
What does GOSUB 2000 mean? There was no REM statement at 2000 saying what the subroutine did!
The NASCOM used Tape for storage and did not have a file system. I suppose I could have printed to tape and read off the tape.
I brought a Tandy plotter that could be used with the Nascom 2.
http://www.dougrice.plus.com/dev/UART/UART2_Plotter.htm part-emulates a Tandy plotter.
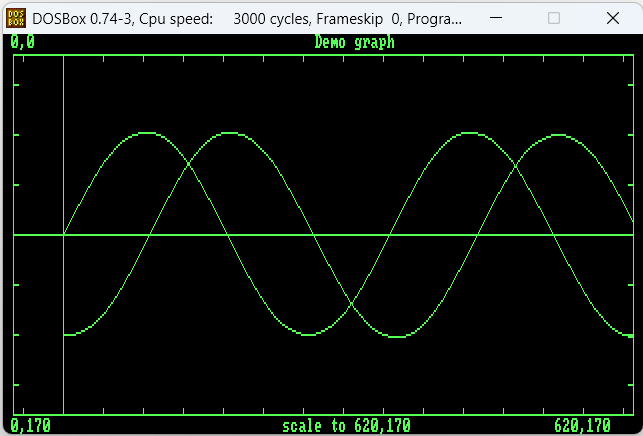
I brought a copy of TurboPascal that ran on an Amstrad 664 and another copy for the IBM XT computer.
I was clearing out and found the manual, and thought why not write a sampler in Turbo Pascal Graphics.
http://www.dougrice.plus.com/dev/graphs/GPHDEMO.PAS is a demo using TurboPascal 3.0
Turbo Pascal was floppy based, so it kept the program in memory and compiled from memory. You only had to save occasionally.
Turbo Pascal offered a screen size of 640x200 and in Hi Res mode you could plot in black and white.
The "black" could be one of the 16 dos colours.
The "White" was green.
It had a 320x200 mode that offered more colours.
Later on Borland Turbo C used BGI and VGA resolutions.
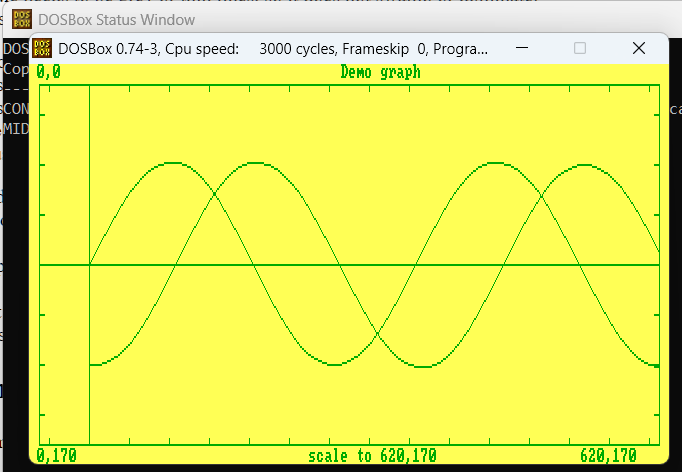
green on yellow:
When you look at 1970's text books and technical papers that are printed black and white.
The graphs tend to have border and ticks.
Possibly, they had a base line for each axis.
The ticks should be plotted starting from the base line towards the edges.
If the graph has a graticule, it needs to be grey, not black.
HTML CANVAS and SVG offer plotting on web pages.
I import the data in a function call, and plot it.
I can import a file of Javascript functions written by a batch file and plot, possibly use a timer to refresh.
You end up with a scale factor and offset to map your data onto the media.
I suppose you can scan the data and find the MIN and MAX for X and Y and the media dimensions to calculate the fiddle factor.
20 years ago PHP and LUA had API that used the GD library.
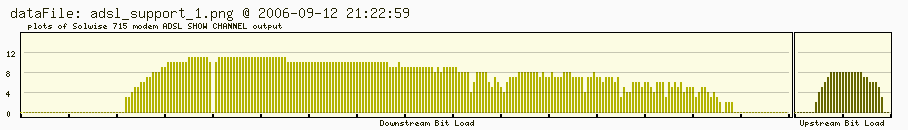
http://www.dougrice.plus.com/Erlangs/adsl.htm used LUA and GD to plot data.
http://www.dougrice.plus.com/Erlangs/adsl_Appendix.htm#l24 - has links to LUA and GD documentation.

I suppose a knowledge of Technical drawing might equip you to lay out a diagram. A graphics and art degree could help with picking colours.
The HTML CANVAS provides a way to plot graphs.
The image can be saved a png file
http://www.dougrice.plus.com/dev/graphs/graph1sample.htm
http://www.dougrice.plus.com/dev/graphs/graphPi.htm - plots temperatures
You have use the techniques used in TurboPascal or use a library like flot.
I was told about FLOT a long time ago: https://www.flotcharts.org/
Using FLOT: http://www.dougrice.plus.com/dev/dtmfCode/pcm2/flotscope.htm
HTML offers the CANVAS, and you have to use JavaScript which I used in the example above.
I was looking at how Tommy Thorn's Nascom 2 emulator worked.
http://www.dougrice.plus.com/nascom2/JavaScriptNascom2/jsnascom.html
You can use SVG:
http://www.dougrice.plus.com/rt004/sr3/reportSVG.svg
http://ccgi.dougrice.plus.com/cgi-bin/wiki.pl?Webpages_And_JavaScript_Simulations has some experiments
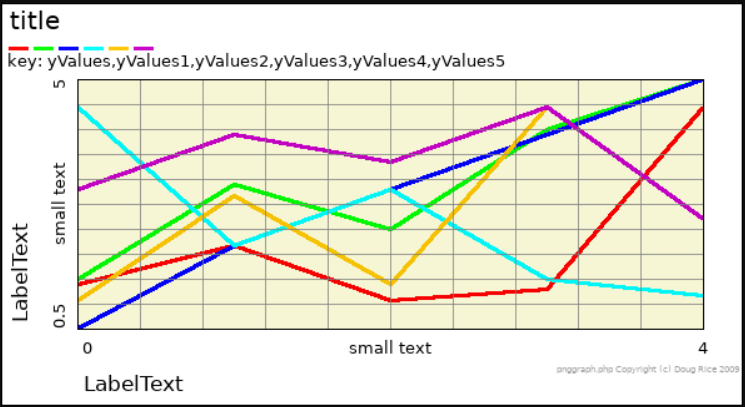
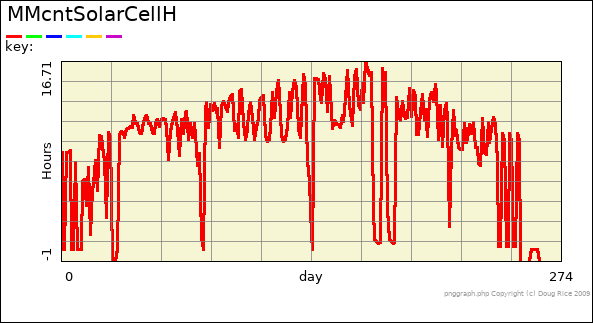
PHP supports the GD graphics and is enabled on some web servers. I wrote a script that would plot data uploaded in the query string.
http://www.dougrice.plus.com/rt004/sr3/pnggraph.php.txt
Example
http://www.dougrice.plus.com/g.htm collects some examples.
http://www.dougrice.plus.com/rt004/sr3/reportCsv.htm
http://ccgi.dougrice.plus.com/cgi-bin/wiki.pl?OnlineTools has examples.
I downloaded this using a right mouse click.
![[Home]](../ipstats.gif)